
Statistical Analysis
Statistical Analysis
After preprocessing, we may now proceed to different statistical analysis. Each analysis requires further procedures in order to narrow down the information needed for the statistical design.
Structural Analysis
Analyzing structural images usually measures changes in the brain structure or brain regions across individuals. Below are available analyses for structural images.
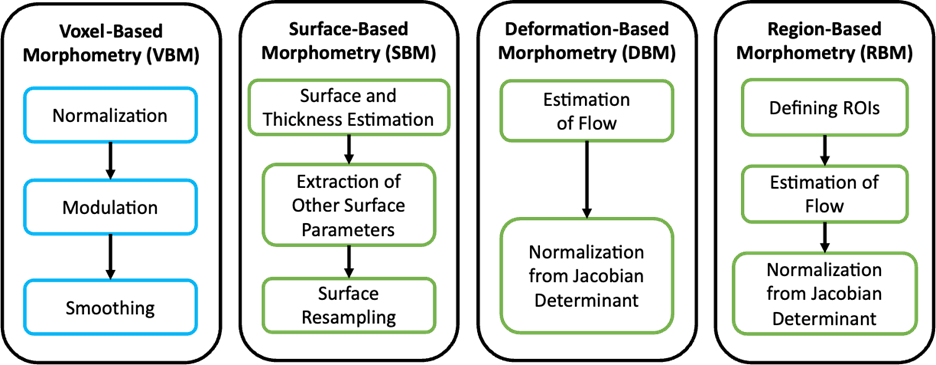
Voxel-Based Morphometry
In this analysis, the local concentration of gray matter (GM) or white matter (WM) is compared between groups. Each voxel is analyzed individually after spatial normalization to a standard template space. Applications include: a) investigating atrophy patterns and identifying regions of GM loss, and b) relating regional differences to motor and cognitive impairment. The outputs are measurement of changes in brain tissue volume and tissue density.
Surface-Based Morphometry
Each structural image is normalized to a spherical surface representing structural boundaries such as white matter surface, or the interface between gray matter and cerebral cortex. Applications include: a) tracking changes in cortical thickness and shape during development or aging, and b) providing insights into complexity and organization of cortex in various neurological and psychiatric disorders. The outputs are measurements of fractal dimension, gyrification index, sulcus depth, surface ratio, and cortical thickness
Deformation-Based Morphometry
In this analysis, a nonlinear registration is used to normalize each structural image, correcting the global orientation and size of the brain. The flow is obtained as the Jacobian determinant, which is used to minimize the regional differences due to local deformations. Applications include: a) assessing structural changes in TBI, aiding in treatment planning, and b) tracking progression of neurodevelopment or cognitive decline. The outputs are measurements of percentage change in volume per voxel
Region-Based Morphometry
In this analysis, the normalization is done for each targeted region of interest (ROI) defined from an atlas. Applications include: a) identifying correlations between brain structure and cognitive or behavioral deficits, and b) tracking progression of disease or effects of intervention over time. The outputs are measurements of mean tissue volume per ROI, and surface-based observables per ROI
Functional Analysis
Analyzing functional images allows us to see how each brain region is interconnected forming a network, and learn which regions activate when performing a certain task. Below are the available analyses for functional images
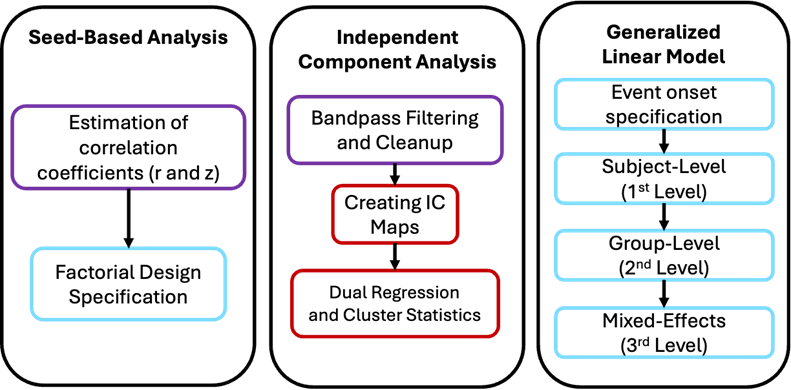
Seed-Based Analysis
This analysis is commonly applied to resting-state fMRI. Here, the connectivity patterns between a seed region and other voxels are characterized. Applications include: a) mapping out functional connectivity of brain regions relevant to specific cognitive functions or clinical disorders, and b) identifying differences in connectivity between population groups. The outputs are measurements of Pearson correlation coefficient between the seed ROI and voxel, and the corresponding z-score
Independent Component Analysis
This analysis decomposes the signals into distinct independent components. Each component is associated with a spatial map which helps identify connectivity networks (e.g. resting state network, default mode network, central executive network) or sources of noise. Applications include: a) uncovering resting state networks and their time courses, and b) identifying unexpected responses to stimuli or transient task-related responses. The outputs are various independent component maps
Generalized Linear Model
This analysis is commonly applied to task related fMRI. The model uses one or more regressors to predict an outcome, which is the BOLD signal. Applications include modeling the temporal dynamics of BOLD signals including hemodynamic response function and its derivatives. The outputs are coefficients of the fitted BOLD timeseries
Diffusion Analysis
Analyzing diffusion-based images allows us to see pathways through the white matter tracts. Below are the available analyses for functional images.
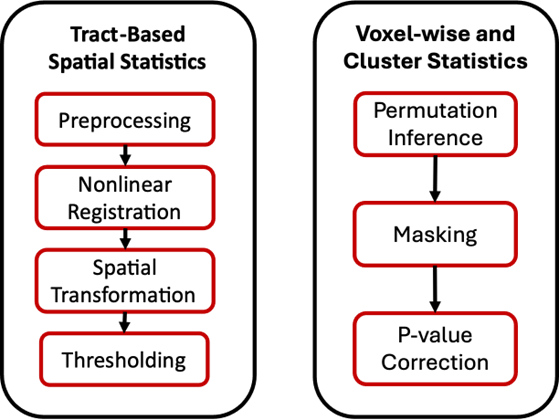
Tract-based Spatial Statistics
This analysis aligns dMRI and measures mean anisotropy. The mean image is then thinned to create a skeletonized mean image. Applications include tracking progression of microstructural changes in white matter tracts during aging or development. The outputs are mean and skeletonized images of the fractional anisotropy, mean diffusivity coefficient, mode of anisotropy, eigenvectors and eigenvalues
Voxel-wise and Cluster Statistics
In this analysis, a nonparametric permutation inference is applied for each voxel. Clusters are defined via threshold-free cluster enhancement (TFCE) which uses nonbinary thresholding. Applications include: a) pinpointing regions of altered anisotropy to detect lesion and changes in pathways, and b) identifying patterns of atrophy for tracking progressions of different neurological disorders. The outputs are percentage changes of the fractional anisotropy, mean diffusivity coefficient, mode of anisotropy, eigenvectors and eigenvalues
PET Analysis
Analyzing PET images allows us to measure metabolic activity of each brain region. Below are the available analyses for functional images
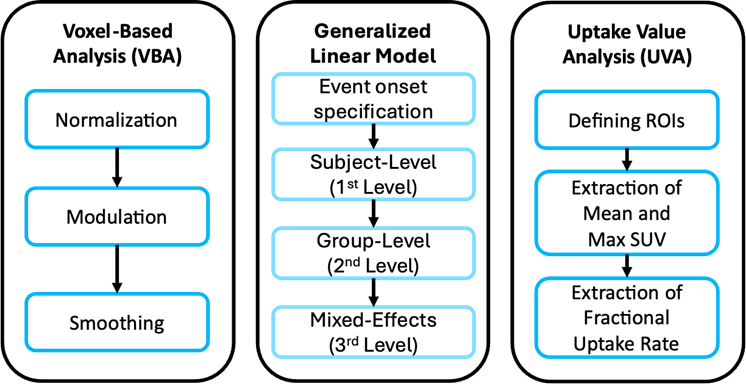
Voxel-Based Analysis
Since PET images are 3D similar to structural images, we can use voxel-based analysis to investigate local concentration of radiotracers between groups. Each voxel is analyzed individually after spatial normalization to a standard template space. The outputs are measurement of changes in the uptake value
Generalized Linear Model
Similar to fMRI, we apply a model that uses one or more regressors to predict an outcome, in this case the metabolic activity. The outputs are coefficients of the fitted BOLD timeseries
Uptake Value Analysis
In this analysis, the mean standard uptake values (SUV) are compared between voxels, or between ROI and voxels. The outputs are the maximum and mean SUV, as well as the fractional uptake rate

Imaging Data and Analysis
Clinical and Neuropsychological Assessment
Structural MRI
Functional MRI
DTI
FDG-PET
Neuromap-PH
info@neuromap.ph